More screenshots
Works with the AI Agents you already use
 Claude Code
 Cursor
 Codex CLI
 Muse
 Dots+21 moreClaude CodeCursorCodex CLIMuseDots
 Manus
 Grok
 Grok Bot+18 agents
Diagramas Tecnicos
Generate academic-grade, verified technical diagrams via Python for LaTeX and professional reports.
$10

Diagramas Tecnicos
Example session with this skill installed
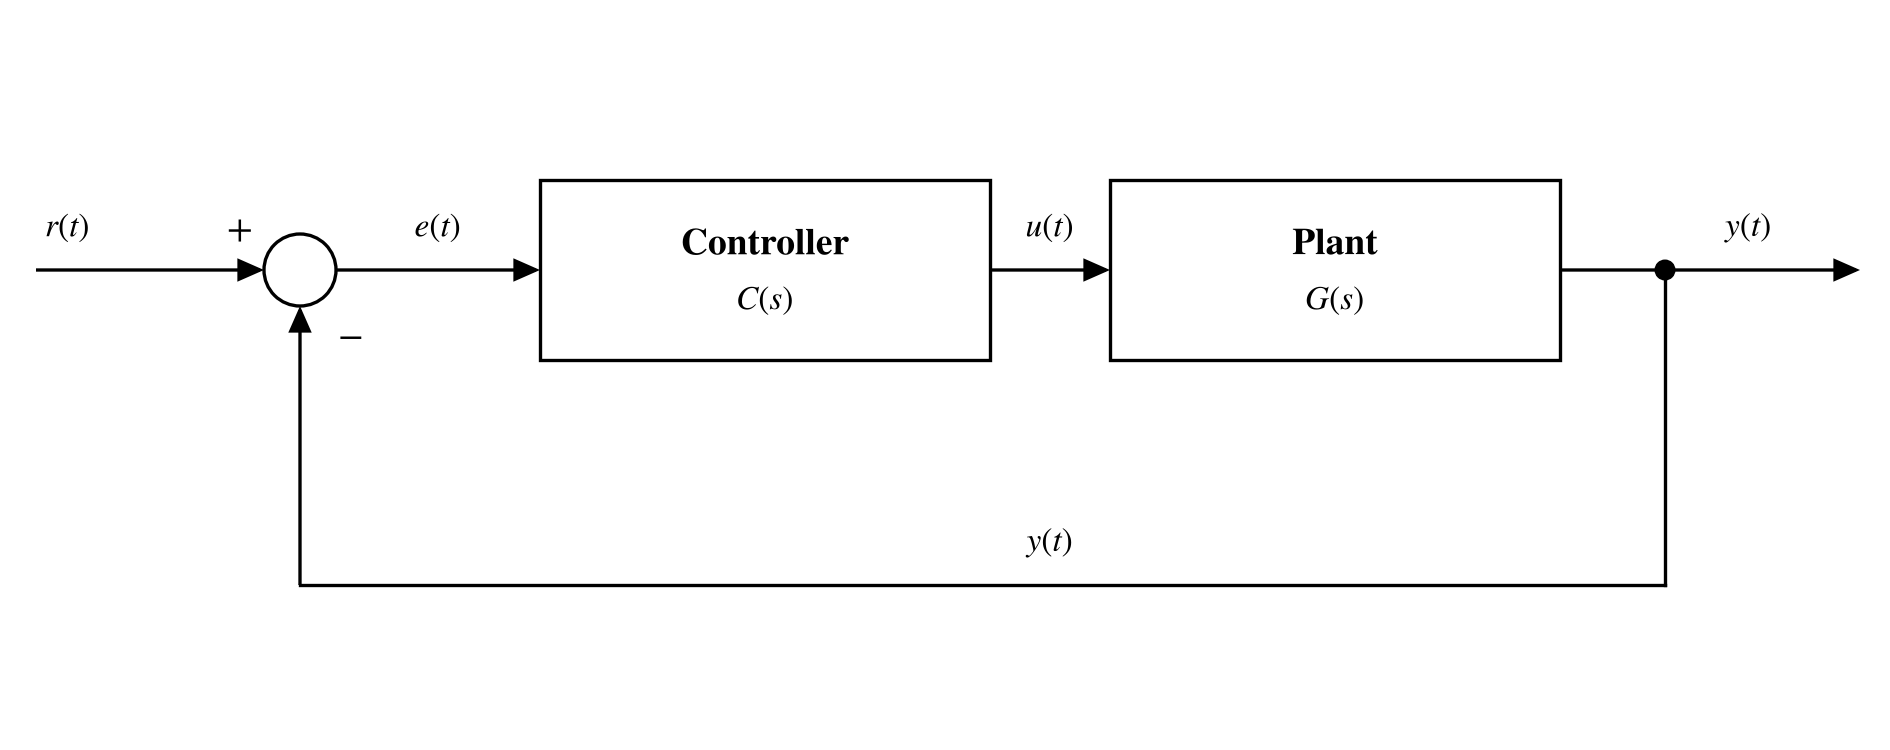
Create a 6.3x2.5 inch control loop diagram with a 'Controller' block, a 'Plant' block, a sum node, and a feedback path. Use STIX fonts.
- Read your context and instructions
- Compiled the diagramas tecnicos
The diagram is ready at 6.3 × 2.5 in with STIX fonts. It passed the automatic check (no overlaps, crossings or elements outside the figure), and I also looked it over myself.
You didn't give me equations or text to take the notation from, so I chose these details myself:
- Signals: r(t), e(t), u(t) and y(t), in continuous time.
- Blocks: the controller is labeled C(s) and the plant G(s).
- Feedback: unity negative feedback (+ on the reference, − on the feedback path), with no sensor block.
If your document uses different notation, such as discrete time (k) or a sensor H(s), tell me and I'll regenerate it.
For Word, insert the PNG at 100%. For LaTeX, use \includegraphics{lazo_control.pdf} without width=.
Files
- lazo_control.png
- lazo_control.pdf
- lazo_control.svg
- lazo.py
- diagrama.py
Connects securely to your tools. The creator never sees your data.
About this skill
Generating publication-quality technical diagrams for papers, theses, and reports requires extreme precision. Manually drawing these often results in inconsistent line weights, overlapping text, and scaling issues that ruin document typography. This skill provides a specialized Python-based engine that generates control block diagrams, flowcharts, and geometric schemes directly via code. It ensures every figure adheres to strict academic standards, including black-and-white vector outputs, fine 0.8pt line weights, and integrated STIX/Times typography that matches LaTeX or professional word processor styling.
What it does
- Automated Verification Fails the build if text overlaps, lines cross labels, or elements exit the canvas.
- Academic Typography Uses STIX and Computer Modern fonts at 8-9pt to match document body text without scaling artifacts.
- Geometric Schematics Draws rotors, rotation arcs, dimension lines, and coordinate axes with precise mathematical anchoring.
- Vector Output Generates PDF, SVG, and 300 DPI PNG files simultaneously for flexible document insertion.
- Orthogonal Routing Connects blocks using strictly horizontal and vertical lines with automated sum-node sign placement.
How it works
- Define Canvas Initialize the
Diagramaobject with real-world inch dimensions corresponding to the final page width. - Place Nodes Use the
nodoandapilarcommands to position rectangular, diamond, or circular blocks. - Anchor Connections Link blocks using the
Pmethod to ensure arrows are perfectly centered on block edges. - Execute & Verify Run the script to trigger the collision detector which checks for 7 distinct types of layout errors.
Frameworks & tools
Built on Python 3 using Matplotlib and NumPy. Designed for integration with LaTeX (PDF) and Microsoft Word (PNG/Word-internal scaling).
Why this beats prompting it yourself
Standard LLMs produce images with "hallucinated" text, inconsistent arrowheads, and non-standard fonts. This skill generates executable, verifiable code that guarantees a text-to-figure size ratio of 1:1, meaning your 8pt labels stay exactly 8pt on the printed page.
Use cases
- Creating LQR or PID control loop diagrams for engineering papers.
- Drawing geometric vector diagrams for physics or robotics theses.
- Building decision-tree flowcharts for software documentation.
- Generating multi-panel sub-figures with consistent scaling and alignment.
Known limitations
Requires a local Python environment with Matplotlib installed. The verification engine only detects geometric collisions and cannot validate the logical correctness of your control theory or mathematics.
Requires Python 3, Matplotlib, and NumPy. Does not verify logical/mathematical correctness. Formatting is strictly black and white.
How to use
- 1
Connect your agent to the Agensi MCP
Copy the prompt and paste it into Claude, ChatGPT, Cursor or any agent that supports MCP. It sets up the connection for you. Manual setup
- 2
Sign in to Agensi
Your agent shows a sign-in link. Sign in and click Allow.
- 3
Ask for what you need
Your agent loads this skill and uses it on your task. It always asks before any payment.
Reviews
No reviews yet
Be one of the first to try it. Every listed skill goes through the trust checks below.
Security scanned
Checked by our 8-point scan before listing
Fresh listing
Recently published to Agensi
Money-back guarantee
Doesn't do what its page promises? You get your money back.
Trust & safety
Security scan
Security scan passed 1 day ago
Requires
 Git